http://mathoverflow.net/questions/38864/visualizing-orthogonal-polynomials
https://en.wikipedia.org/wiki/Orthogonal_polynomials
Above are really nice explanations on the orthogonal polynomial.
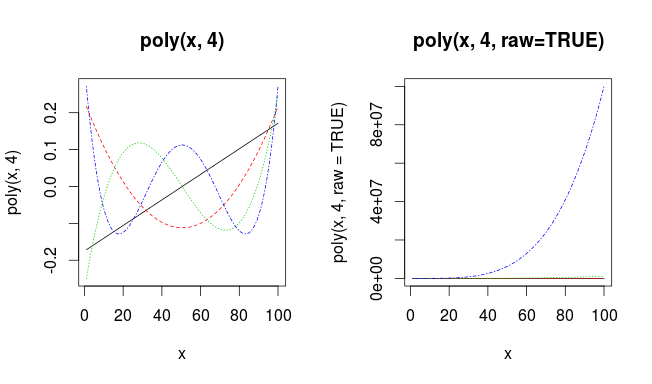
Here’s R code to visualize orthogonal polynomial and raw polynomials.
x <- 1:100
par(mfrow=c(1, 2))
matplot(x, poly(x, 4), type='l', main="poly(x, 4)")
matplot(x, poly(x, 4, raw=TRUE), type='l', main="poly(x, 4, raw=TRUE)")
Here’s poly(x, 4, raw=TRUE) – as it’s hard to read in the plot.
> head(poly(x, 4, raw=TRUE))
     1  2   3    4
[1,] 1  1   1    1
[2,] 2  4   8   16
[3,] 3  9  27   81
[4,] 4 16  64  256
[5,] 5 25 125  625
[6,] 6 36 216 1296

> tail(poly(x, 4, raw=TRUE))
         1     2       3         4
[95,]   95  9025  857375  81450625
[96,]   96  9216  884736  84934656
[97,]   97  9409  912673  88529281
[98,]   98  9604  941192  92236816
[99,]   99  9801  970299  96059601
[100,] 100 10000 1000000 100000000
