Multivariate Adaptive Regression Spline is an extension of linear regression to handle non-linearity as explained in the wikipedia.
In R,
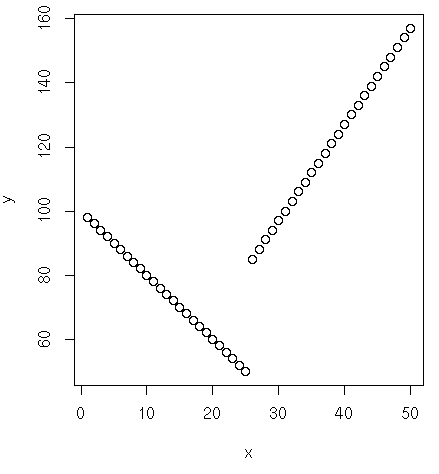
> d <- data.frame(x=c(1:50), y=c(1:25*(-2)+100, 26:50*3+7))
> plot(d)
Certainly, this can not be described by a simple linear model:

We use earth:
> library(earth)
> e <- earth(y ~ x, d)
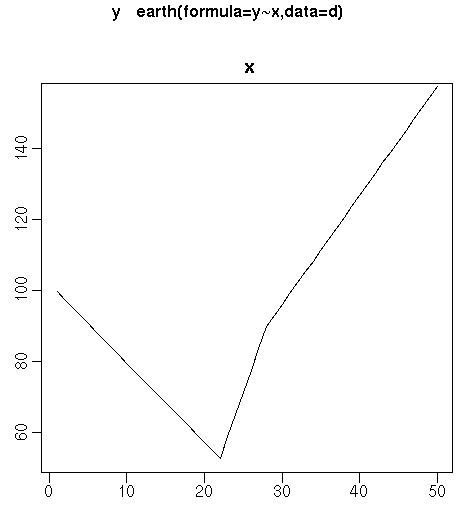
> plotmo(e)

 grid:    x
       25.5

As one can see, we have a couple of hinges:
> summary(e)
Call: earth(formula=y~x, data=d)

            coefficients
(Intercept)    52.594370
h(x-22)         6.208889
h(22-x)         2.237602
h(x-28)        -3.132070

Selected 4 of 4 terms, and 1 of 1 predictors
Importance: x
Number of terms at each degree of interaction: 1 3 (additive model)
GCV 21.50975    RSS 795.4307    GRSq 0.9767953    RSq 0.9821302
More at Notes on earth package. There’s other package called mars which also implements this feature. Also, one may consider library splines.