Install tree package:
> install.packages(“tree”)
> library(tree)
Let’s check how iris looks:
> iris[1:4,]
  Sepal.Length Sepal.Width Petal.Length Petal.Width Species
1          5.1         3.5          1.4         0.2  setosa
2          4.9         3.0          1.4         0.2  setosa
3          4.7         3.2          1.3         0.2  setosa
4          4.6         3.1          1.5         0.2  setosa
Build tree:
> attach(iris)
> dt = tree(Species ~ ., iris)
Let’s check how it looks:
> dt
node), split, n, deviance, yval, (yprob)
      * denotes terminal node
 1) root 150 329.600 setosa ( 0.33333 0.33333 0.33333 )
   2) Petal.Length < 2.45 50   0.000 setosa ( 1.00000 0.00000 0.00000 ) *
   3) Petal.Length > 2.45 100 138.600 versicolor ( 0.00000 0.50000 0.50000 )
     6) Petal.Width < 1.75 54  33.320 versicolor ( 0.00000 0.90741 0.09259 )
      12) Petal.Length < 4.95 48   9.721 versicolor ( 0.00000 0.97917 0.02083 )
        24) Sepal.Length < 5.15 5   5.004 versicolor ( 0.00000 0.80000 0.20000 ) *
        25) Sepal.Length > 5.15 43   0.000 versicolor ( 0.00000 1.00000 0.00000 ) *
      13) Petal.Length > 4.95 6   7.638 virginica ( 0.00000 0.33333 0.66667 ) *
     7) Petal.Width > 1.75 46   9.635 virginica ( 0.00000 0.02174 0.97826 )
      14) Petal.Length < 4.95 6   5.407 virginica ( 0.00000 0.16667 0.83333 ) *
      15) Petal.Length > 4.95 40   0.000 virginica ( 0.00000 0.00000 1.00000 ) *
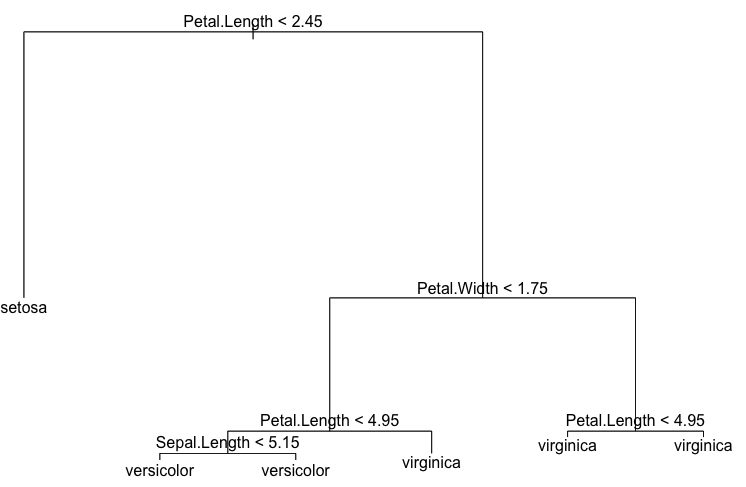
There are 6 terminal nodes in the tree. Let’s plot it:
> plot(dt)
> text(dt)
See how accurate it is:
> summary(dt)
Classification tree:
tree(formula = Species ~ ., data = iris)
Variables actually used in tree construction:
[1] “Petal.Length” “Petal.Width”  ”Sepal.Length”
Number of terminal nodes:  6
Residual mean deviance:  0.1253 = 18.05 / 144
Misclassification error rate: 0.02667 = 4 / 150
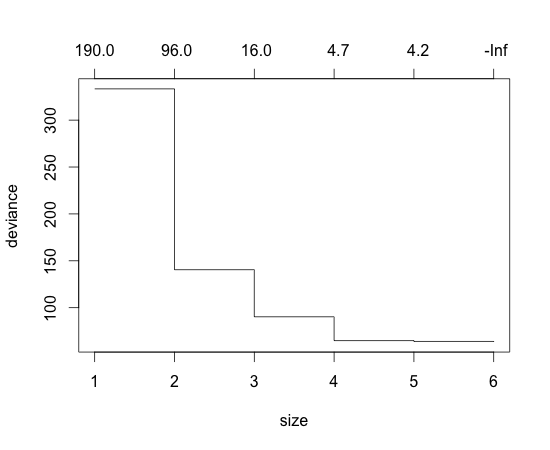
We have pretty small misclassification rate. But, to avoid overfitting, let’s do k-fold cross-validation and prune the tree:
> ct = cv.tree(dt, FUN=prune.tree)
> plot(ct)
Deviance (entropy like measure used in R to estimate impurity in decision tree) is smal when the number of terminal node is 4~6. Let’s cut the tree so that the number of terminal node is 4:
> pt = prune.tree(dt, best=4)
> pt
node), split, n, deviance, yval, (yprob)
      * denotes terminal node

 1) root 150 329.600 setosa ( 0.33333 0.33333 0.33333 )
   2) Petal.Length < 2.45 50   0.000 setosa ( 1.00000 0.00000 0.00000 ) *
   3) Petal.Length > 2.45 100 138.600 versicolor ( 0.00000 0.50000 0.50000 )
     6) Petal.Width < 1.75 54  33.320 versicolor ( 0.00000 0.90741 0.09259 )
      12) Petal.Length < 4.95 48   9.721 versicolor ( 0.00000 0.97917 0.02083 ) *
      13) Petal.Length > 4.95 6   7.638 virginica ( 0.00000 0.33333 0.66667 ) *
     7) Petal.Width > 1.75 46   9.635 virginica ( 0.00000 0.02174 0.97826 ) *

> summary(pt)
Classification tree:
snip.tree(tree = dt, nodes = c(7, 12))
Variables actually used in tree construction:
[1] “Petal.Length” “Petal.Width”
Number of terminal nodes:  4
Residual mean deviance:  0.1849 = 26.99 / 146
Misclassification error rate: 0.02667 = 4 / 150
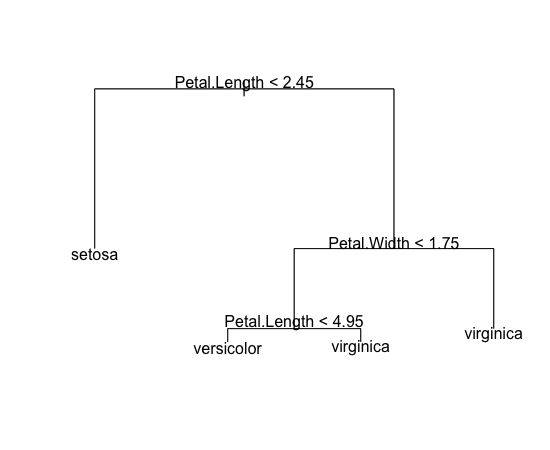
In this pruning, misclassification rate for training data isn’t worse than the original tree which is nice. Let’s plot it:
> plot(pt)
> text(pt)
The tree is now much simpler than the previous one, but we expect it to perform better for new data.
Let’s do prediction:
> predict(pt, iris[1,])
  setosa versicolor virginica
1      1          0         0
> iris[1,]
  Sepal.Length Sepal.Width Petal.Length Petal.Width Species
1          5.1         3.5          1.4         0.2  setosa
We got correct answer.
However, in real world situation, we should have kept some data for the purpose of final evaluation and shouldn’t have used it for training.
References)
1. 구자용, 박현진, 최대우, 김성수, “데이터마이닝”, Knou Press.


