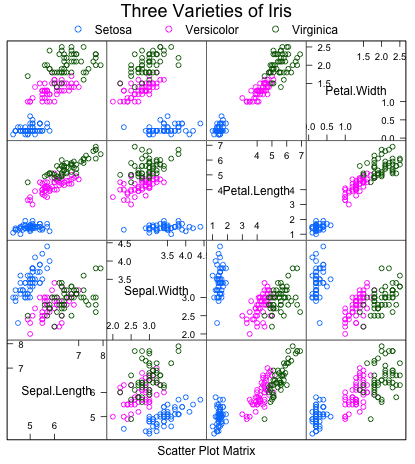
Don’t use pairs, but splom.
> super.sym <- trellis.par.get(“superpose.symbol”)
> splom(~iris[1:4], groups = Species, data = iris,
      panel = panel.superpose,
      key = list(title = “Three Varieties of Iris”,
                 columns = 3,
                 points = list(pch = super.sym$pch[1:3],
                 col = super.sym$col[1:3]),
                 text = list(c(“Setosa”, “Versicolor”, “Virginica”))))
Reference)
R: Scatter Plot Matrices. http://stat.ethz.ch/R-manual/R-devel/library/lattice/html/splom.html
