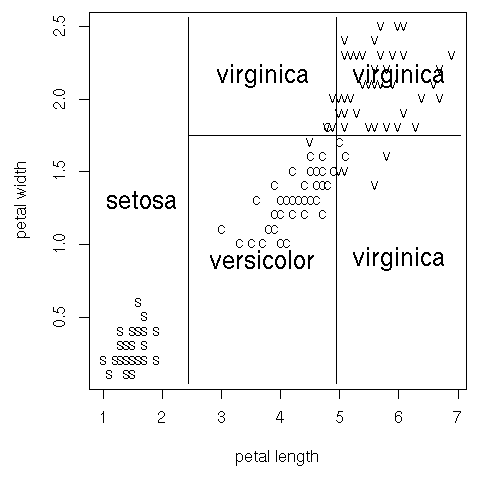
This is slightly modified version of example in tree package reference manual.
Partition plot can draw a diagram representing leaves of a tree.
> head(iris)
  Sepal.Length Sepal.Width Petal.Length Petal.Width Species
1          5.1         3.5          1.4         0.2  setosa
2          4.9         3.0          1.4         0.2  setosa
3          4.7         3.2          1.3         0.2  setosa
4          4.6         3.1          1.5         0.2  setosa
5          5.0         3.6          1.4         0.2  setosa
6          5.4         3.9          1.7         0.4  setosa
> t <- tree(Species ~ Petal.Length + Petal.Width, iris)
# Draw plot in a square region. See the graph in the below.
> par(pty="s")
# iris[, 3]: petal length, iris[, 4]: petal width
> plot(iris[, 3], iris[, 4], type="n", xlab="petal length", ylab="petal width")
# iris[, 5]: Species as a factor.
> class(iris[, 5])
[1] "factor"
> iris[1,5]
[1] setosa
Levels: setosa versicolor virginica
# s: setosa, c: versicolor, v: virginica
> text(iris[, 3], iris[, 4], c("s", "c", "v")[iris[, 5]])
> partition.tree(t, add=TRUE, cex=1.5)
Then we get a plot like:

Reference)
http://cran.r-project.org/web/packages/tree/tree.pdf